10 April 2014

When building typical web applications using ASP.NET WebForms and ASP.NET MVC, the usual way of testing and debugging is to see whether the page loaded correctly (ie whether it displays the correct data or not). However, when building ajax applications / single page applications, you want to test not only the appearance of the page but more importantly the results of API calls. Since these results may not be obvious by just looking at the page, we need a different method of testing.
Here are some reasons why looking at a page might not be the best way to test or debug an ajax / single page application:
Fiddler is a free, lightweight, downloadable tool that has many functions, including monitoring HTTP/HTTPS traffic. I have found it very useful when testing API calls, but it also captures page requests.
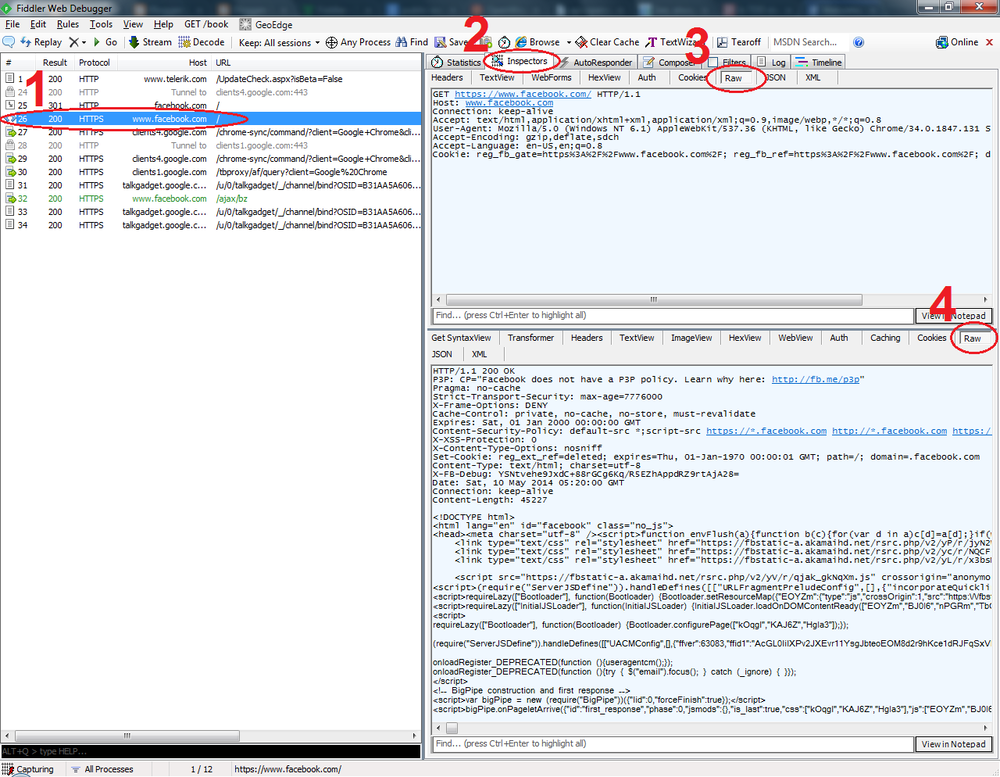
Let’s start by going to a website. Open Fiddler and then, in a browser, go to http://www.facebook.com. Fiddler records the HTTP request-response pair. Here’s what Fiddler looked like on my machine (click to enlarge):

I have selected the request to facebook in the left pane (1) and opened the Inspectors tab in the right pane (2). Still on the right pane, I clicked the Raw button for the request (3) and the Raw button for the response (4). So in the request pane we can see the actual HTTP request that my browser made - action, url, headers, body (though there isn’t one for this particular request), cookies, and all data appropriate for a request. Conversely, we see the HTTP response in the response pane.
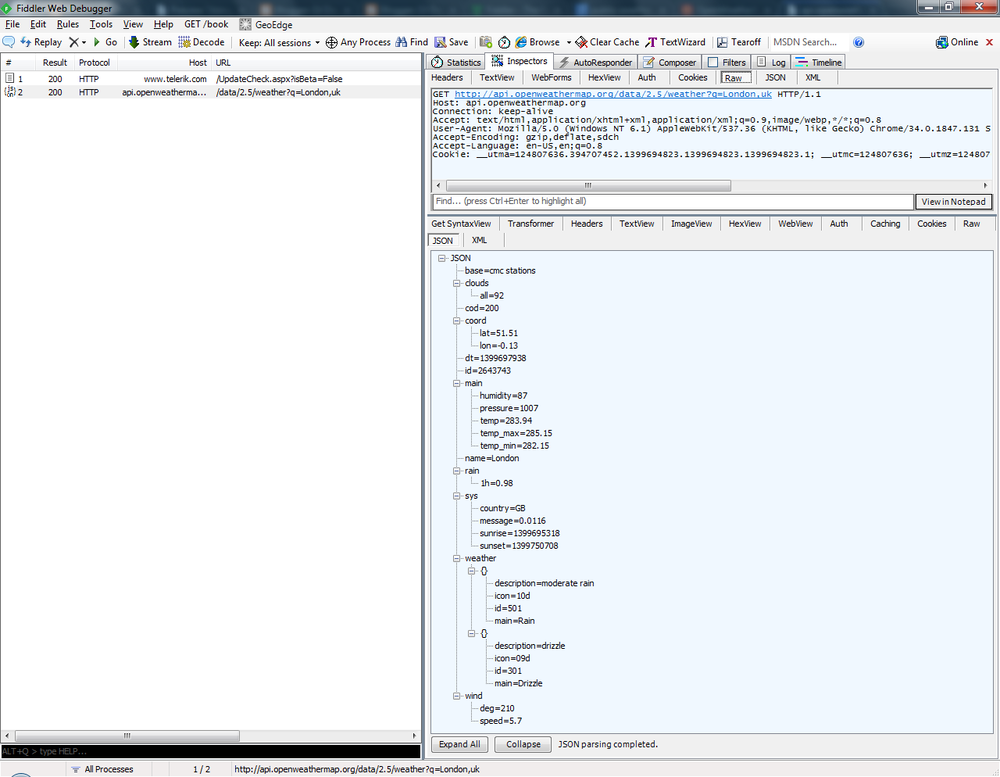
Now let’s inspect an API call. For this demo I used an API exposed by OpenWeatherMap. I made a call to http://api.openweathermap.org/data/2.5/weather?q=London,uk, which returns weather information about London in JSON format. I went to that URL through a browser, and here is what Fiddler looks like:

In the response pane, I selected JSON instead of Raw. As you can see, Fiddler displays the content in a nice, formatted way. It will be unformatted when viewed through a browser (at least in the current version of Google Chrome).
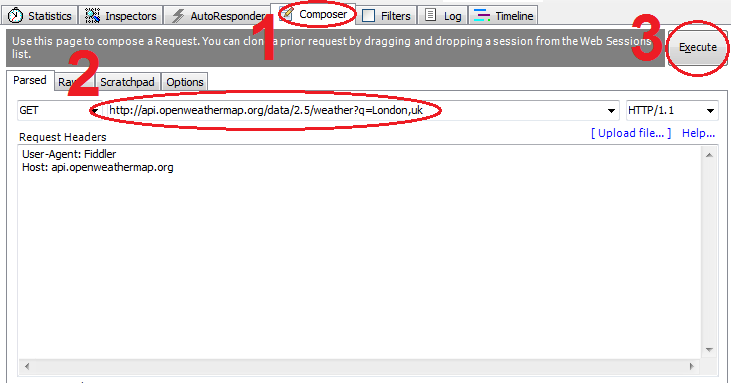
You can also make HTTP requests without the use of a browser by using the Composer tab:

Head over to the Composer tab (1), enter the URL in the field provided (2) and click Execute (3). As with any request, this one will appear in Fiddler’s left pane. Selecting it and opening the Inspector will let you see the actual HTTP request and response pair.
Recording HTTP / HTTPS traffic is very powerful already, but it’s not the only thing Fiddler can do. You can also do web session manipulation, security testing, and much more. Check out Fiddler’s Key Features for more information.